

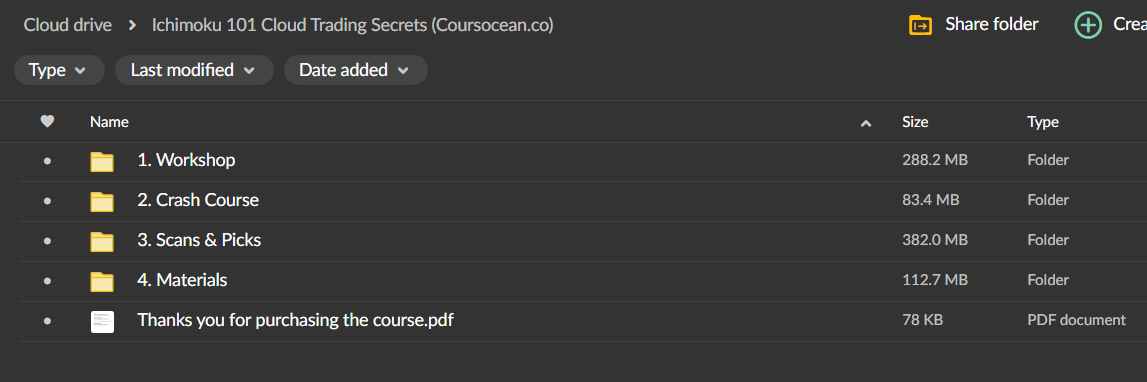
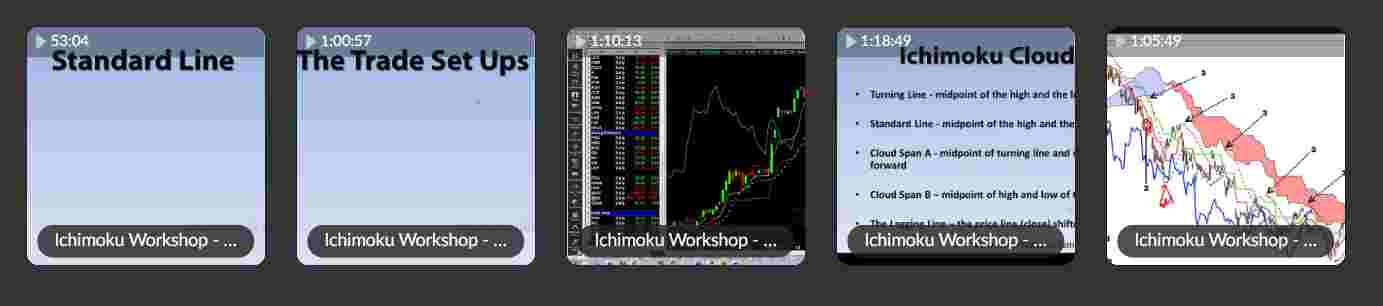
Ichimoku 101 – Cloud Trading Secrets Course
$22.99
REGULAR PRICE – $ 197 .
WE OFFER – $ 22.99 .
About Course :-
The Ichimoku Kinko Hyo indicator looks complicated at first glance — five lines, a cloud, multiple timeframe relationships all displayed on a single chart. Because of that visual complexity, most traders either avoid it entirely or learn one piece of it in isolation and miss the system underneath.
Used correctly, Ichimoku is one of the more complete technical analysis frameworks available. It identifies trend direction, momentum, support and resistance, and potential entry timing — all from a single indicator. The challenge isn’t the indicator itself. It’s learning to read it as a system rather than a collection of separate signals.
Ichimoku 101 – Cloud Trading Secrets is Hubert’s structured course on how to do exactly that. It covers his personal approach to scanning markets with Ichimoku, the seven specific setups he returns to consistently, and the filtering process he uses to separate high-quality trade opportunities from noise.
What the Course Covers
Hubert’s Seven Favorite Ichimoku Setups
Rather than trying to cover every possible Ichimoku configuration, this section focuses on the seven setups Hubert uses most consistently in his own trading. Each setup is explained in detail — what conditions need to be present, what the signal looks like on the chart, and how to evaluate whether a particular instance of the setup is worth taking.
Working with a defined set of setups rather than an open-ended list of possibilities is one of the more practical aspects of this course. It gives you something specific to look for rather than a general framework that’s easy to understand conceptually but hard to apply in real market conditions.
Market Scanning with Ichimoku
Knowing how to read a setup is one thing. Knowing how to efficiently scan across markets to find those setups is a separate skill that doesn’t get covered in most indicator-focused courses. This section walks through Hubert’s market scanning process — how he uses Ichimoku to quickly assess which markets and timeframes are worth closer attention and which ones to set aside.
Trade Filtering and Setup Selection
Not every Ichimoku signal is worth acting on, and one of the most useful things this course covers is how Hubert filters the signals he sees down to the ones with the strongest confluence. This section explains the specific criteria he uses to evaluate setups and how he distinguishes between trades he’ll take and ones he’ll pass on — even when the basic signal is technically present.
Exact Indicator Settings and Trading Rules
One of the more practical inclusions in the course is direct access to the specific Ichimoku settings Hubert uses. The default settings on most platforms aren’t necessarily the ones that work best for every market or timeframe, and understanding why Hubert uses the settings he does — not just what they are — gives you a foundation for applying them thoughtfully rather than copying them blindly.
The trading rules section covers the specific conditions that govern how Hubert uses the indicator: what has to be true before he considers a trade, what he looks for to confirm a signal, and what conditions would lead him to stay out even when a setup looks promising on the surface.
Cloud Charting Checklist
The checklist is a practical reference tool for working through Ichimoku analysis in a consistent order. When you’re developing fluency with a multi-component indicator like Ichimoku, having a structured checklist helps ensure that you’re evaluating all the relevant elements of the chart — particularly in the early stages when the process isn’t yet automatic.
Ichimoku Cheatsheet
The cheatsheet covers the key elements of Ichimoku trading in a condensed, quick-reference format. It’s a useful companion to the course material rather than a standalone resource — something to keep accessible during live analysis while you’re still building familiarity with the system.
Honest Expectations
Ichimoku is a genuine technical analysis system with a meaningful learning curve. This course gives you Hubert’s specific interpretation of that system — his settings, his setups, his filtering process — which is a more useful starting point than learning the indicator in the abstract. That said, developing real fluency with Ichimoku takes time and screen time across different market conditions. The course shortens that learning process considerably, but it doesn’t replace the practice required to apply the system confidently in live trading.
Results from applying any technical analysis methodology will vary based on the markets you trade, your risk management approach, and how consistently you apply what you’ve learned.
FAQ :-
1. Who created the Ichimoku 101 course, and are they actually experienced with this indicator?
The course is put together by Hubert Senters, a trader and educator who’s built his teaching around the Ichimoku Kinko Hyo system specifically, not just as one indicator among many. Since Ichimoku is often seen as intimidating due to its multiple lines and cloud formations, having someone who specializes in it (rather than a generalist covering dozens of indicators) is part of why this course stands out.
2. What exactly does “Ichimoku” mean, and why does the course spend time on its history?
Ichimoku Kinko Hyo is a Japanese charting method that translates roughly to “one glance equilibrium chart.” The course covers its origin because understanding why it was designed the way it was — to give traders a full read on trend, momentum, and support/resistance in a single glance — makes the individual components click faster once you get to the technical lessons.
3. Do I need to already understand technical analysis before taking this course?
Not necessarily, but it helps if you’re at least comfortable reading basic price charts. The course is built to work for both beginners exploring Ichimoku for the first time and more experienced traders looking to sharpen their setups, since it starts from the core five components before layering on the more advanced signal combinations.
4. What are the five components of the Ichimoku Cloud that the course focuses on?
The course breaks down all five: Tenkan-sen (conversion line), Kijun-sen (base line), Senkou Span A and B (which form the “cloud” itself), and Chikou Span (the lagging line). Rather than treating these as isolated lines, the lessons focus on how they interact together to signal trend direction and potential reversals.
5. Can this system be applied to markets other than forex, like stocks or crypto?
Yes, Ichimoku isn’t tied to one asset class. Since it’s fundamentally a way of reading trend and momentum from price action, the strategies taught in the course are generally applicable across forex, stocks, and other liquid markets — though as with any indicator-based system, results can vary depending on volatility and timeframe.
View More Courses – Click Here
You must be logged in to post a review.
Related products
-

-
Sale!
 Trading & Investing
Apteros Trading fall 21 intensive (Updated)
Original price was: $1,295.00.$19.99Current price is: $19.99. Add to cart -
Sale!
 Forex & Currency Trading
Jessica Laine – The Total Forex Course
Original price was: $2,999.00.$34.99Current price is: $34.99. Add to cart -
Sale!
 Forex & Currency Trading
ASFX Beginner Training Course
Original price was: $605.00.$11.99Current price is: $11.99. Add to cart

Reviews
There are no reviews yet.